Learn about different ways people create visual representations of their daily food consumption.
Published: February 2026
Visualization refers to the creation of visual representations of information. In the context of food tracking, visualization involves creating images, charts, or other visual formats that display information about food intake.
Many individuals find that visual representations help them understand their eating patterns in ways that written lists or text-based logs may not. Visual formats can make patterns and trends more immediately apparent.
One of the simplest forms of food visualization involves taking photographs of meals and snacks. This creates a visual diary that can be reviewed later to recall what was eaten on particular days.
Some people organize these photos chronologically, while others group them by meal type or other categories. The photographic approach provides a literal visual record of food as it appeared when consumed.
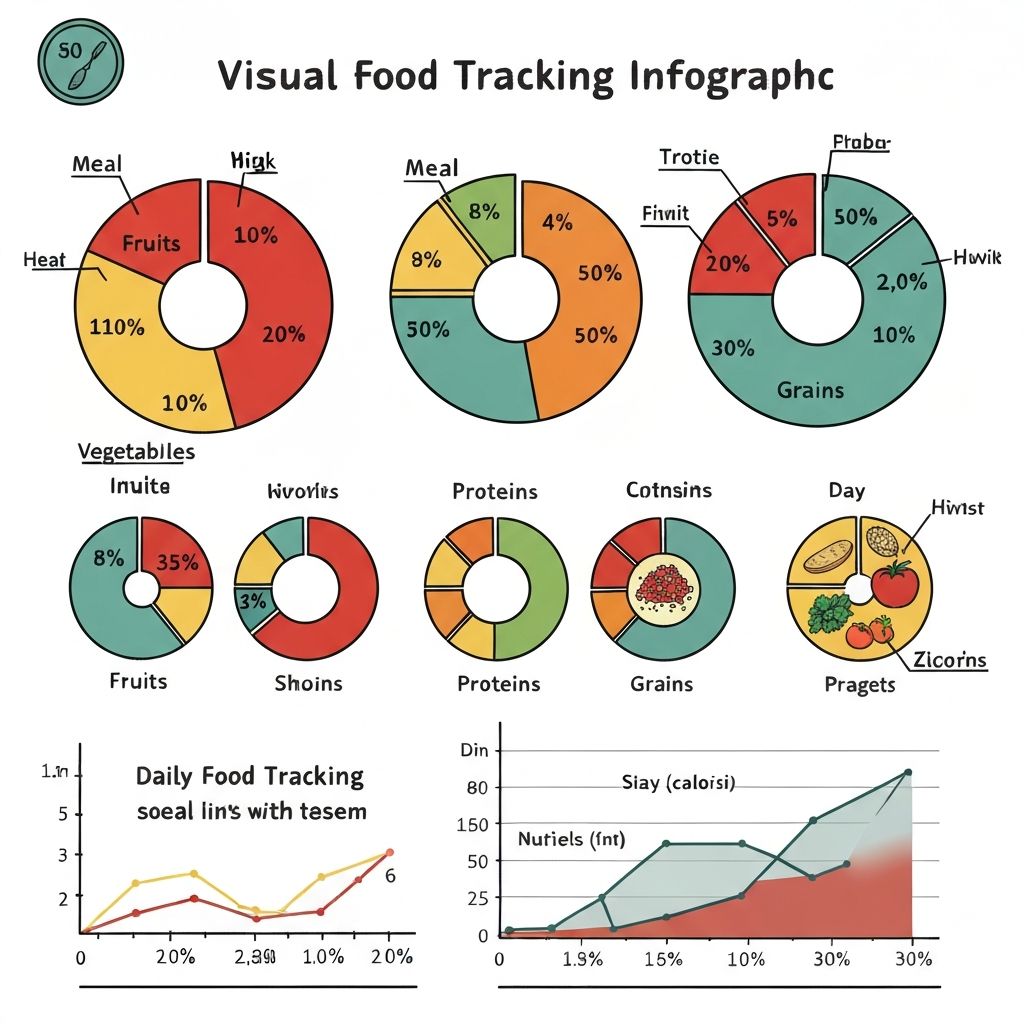
Some individuals create charts or graphs based on their food log data. These might include pie charts showing proportions of different food groups, bar graphs displaying frequency of certain foods, or timeline visualizations showing when meals were eaten.
Such visualizations can be created manually using pen and paper, or digitally using spreadsheet software or specialized applications.
Color coding is a visual technique some people use in their food journals. This might involve using different colored pens or highlighters to mark different types of foods, meal times, or other categories of interest.
The specific meaning of colors is entirely up to the individual. Some might use colors to represent food groups, while others might use them to indicate where meals were eaten or other contextual information.
Some individuals create visual layouts that display multiple days or weeks at a glance. These might resemble calendar formats with spaces for each meal, allowing for quick visual comparison across different days.
Such planners can be created using templates, or individuals may design their own formats that suit their preferences and the information they wish to track.
The tools used for food visualization vary based on the type of visualization and individual preferences. Common tools include:
The choice of tools depends on personal preference, available resources, and the type of visualization being created.
Many people who use visual methods report that they find it easier to notice patterns when information is presented visually rather than in text format. Visual representations can make certain types of information more immediately apparent.
For example, a photograph might capture details about portion sizes or meal composition that might be difficult to describe in writing. A chart might make frequency patterns obvious at a glance.
However, it is important to note that these are general observations about how some individuals experience visual methods. The utility of any particular approach varies from person to person.
Many individuals use combinations of visual and text-based methods. For instance, someone might take photos of meals but also write brief notes about each one. Or they might maintain a written log but use color coding to make certain information more visible.
The combination of methods is entirely a matter of personal preference. There is no standard or prescribed approach to creating food records.
Visual records can be reviewed in various ways. Some people scroll through photos periodically, while others print them and create physical collections. Those who create charts might review them weekly or monthly to observe trends.
The frequency and method of review depend on the individual and their reasons for creating the visualizations in the first place. Some find regular review helpful, while others refer back to their records only occasionally.
It is important to recognize that visualization methods are highly individual. What works well for one person may not appeal to another. Some individuals are naturally visual in their thinking and find visual methods intuitive, while others prefer text-based approaches.
There is no objective best method for visualizing food intake. The most useful approach is simply the one that the individual finds helpful and sustainable for their purposes.
While visual methods can be useful for some individuals, they have limitations. Photographs capture only what is visible on the plate, not necessarily what was eaten. Charts and graphs are only as accurate as the data they are based on.
Additionally, the act of creating visualizations does not, in itself, provide analysis or recommendations. Visualizations simply present information in a visual format. The interpretation of that information remains with the individual.
This article provides educational information about methods some individuals use to visualize their food intake. It does not constitute advice about whether you should use visual methods or which approaches might be suitable for your situation.
The practices described here reflect the variety of approaches different people take. They may or may not be appropriate or useful in any particular case. Individual circumstances and preferences vary greatly.
For personalized guidance related to nutrition, diet, or health matters, individuals should consult with qualified professionals who can provide advice based on specific circumstances.
Visualizing food intake involves creating visual representations of eating patterns through methods such as photography, charts, color coding, or visual layouts. Different individuals use different visualization approaches based on their preferences and what they find helpful.
The information in this article is educational in nature, intended to explain various visualization concepts and methods. It should not be interpreted as recommendations or instructions. The choice of whether to use visualization methods, and which methods to use, is entirely personal and depends on individual circumstances and preferences.